On this page:
About | Σχετικά
The goal of this project is a) to create a comprehensive and thorough map of Ancient Greece that includes all known and probable locations, and b) to produce a map that is informative, accurate, and visually pleasing in both printed and digital formats, that covers every historical era from the Stone Age to the beginning of Imperial Roman Era.
During the process, every point was plotted on the map only after being checked and verified one by one against reliable sources, which can be found in the Map Index and the Bibliography.
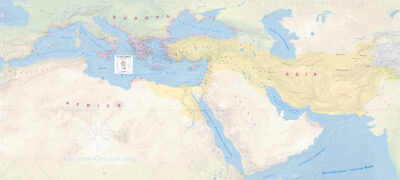
The maps include locations within the modern country as well as regions beyond its borders which, in antiquity, were predominantly inhabited by Greeks, served as centers of Greek influence, were Hellenized, or were administered by Greeks—spanning from the Stone Age to the Roman Era (pre-3000 BCE to approximately 200 CE). It describes the reach of Greek Civilization from Spain to India, and from the Black Sea to Egypt, beginning from the depths of the Stone Age and concluding in Late Antiquity (c. 200 CE).
In short, the maps include locations that a scholar or researcher of this historical period would find essential.
For the most part, the visual design pays tribute to the old school wall maps and geography textbooks of the late 20th century, though some thematic maps feature experimental stylistic approaches.
These maps integrate the editor’s research on Ancient Greece and information design. As such, the map is a living document in constant development, with new additions, corrections, and amendments in each version. Version numbers are located in the map legend.
Development began in 2002, and the project reached maturity in 2025 with version 400, featuring a new base map and 99% of settlements verified and plotted.
These exclusive maps are free for personal use, but reproduction, redistribution, embedding, translation, or publication in any form or medium, sale, or sub-licensing is not permitted.
To obtain a free license, open one of the maps in a full-screen view and select the [License this photo (CC BY-NC-ND 4.0)] link to copy the required attribution text.
Ο σκοπός του έργου είναι α) η δημιουργία ενός ολοκληρωμένου και εμπεριστατωμένου χάρτη της Αρχαίας Ελλάδας που να περιλαμβάνει όλες τις γνωστές και πιθανές τοποθεσίες, και β) ένας χάρτης που να είναι ενημερωτικός, ακριβής και οπτικά καλαίσθητος τόσο σε έντυπη όσο και σε ψηφιακή μορφή, που καλύπτει κάθε ιστορική περίοδο από την Εποχή του Λίθου έως τις αρχές της Ρωμαϊκής Αυτοκρατορικής Περιόδου.
Κατά τη διαδικασία, κάθε σημείο τοποθετήθηκε στον χάρτη αφού ελέγχθηκε και επαληθεύτηκε μία προς μία με αξιόπιστες πηγές, οι οποίες βρίσκονται στο Ευρετήριο του Χάρτη και στη Βιβλιογραφία.
Οι χάρτες περιλαμβάνουν τοποθεσίες εντός της σύγχρονης χώρας, καθώς και περιοχές εκτός αυτής οι οποίες κατά την αρχαιότητα κατοικήθηκαν κυρίως από Έλληνες, ή υπήρξαν κέντρα ελληνικής επιρροής, ή εξελληνίστηκαν, ή διοικήθηκαν από Έλληνες, από τη Λίθινη Εποχή έως τη Ρωμαϊκή Περίοδο (προ του 3000 π.Χ. έως περίπου το 200 μ.Χ.). Περιγράφει την έκταση του Ελληνικού Πολιτισμού από την Ισπανία έως την Ινδία, και από τη Μαύρη Θάλασσα έως την Αίγυπτο, ξεκινώντας από τα βάθη της Λίθινης Εποχής και καταλήγοντας στην Ύστερη Αρχαιότητα (περίπου το 200 μ.Χ.).
Εν συντομία, οι χάρτες περιλαμβάνουν τοποθεσίες που ένας μελετητής ή ερευνητής της ιστορικής περιόδου θα έβρισκε χρήσιμες.
Ως επί το πλείστον, ο οπτικός σχεδιασμός αποδίδει φόρο τιμής στους παλιούς σχολικούς χάρτες τοίχου και τα εγχειρίδια γεωγραφίας των τελών του 20ού αιώνα, αν και ορισμένοι θεματικοί χάρτες διαθέτουν πειραματικό στυλιστικό ύφος.
Αυτοί οι χάρτες ενσωματώνουν την έρευνα του επιμελητή πάνω στην Αρχαία Ελλάδα και τον σχεδιασμό πληροφοριών (information design). Ως εκ τούτου, ο χάρτης είναι ένα ζωντανό έγγραφο σε συνεχή ανάπτυξη, με νέες προσθήκες, διορθώσεις και τροποποιήσεις σε κάθε έκδοση. Οι αριθμοί έκδοσης βρίσκονται στο υπόμνημα του χάρτη.
Η ανάπτυξη ξεκίνησε το 2002 και το έργο έφτασε στην ωριμότητά του το 2025, στην έκδοση 400, με νέο βασικό χάρτη και το 99% των οικισμών επαληθευμένο και τοποθετημένο.
Αυτοί οι αποκλειστικοί χάρτες είναι δωρεάν για προσωπική χρήση, αλλά δεν επιτρέπεται η αναπαραγωγή, η αναδιανομή, η ενσωμάτωση, η μετάφραση ή η δημοσίευση σε οποιαδήποτε μορφή ή μέσο, η πώληση ή η εκ νέου αδειοδότηση.
Για να λάβετε μια δωρεάν άδεια χρήσης, ανοίξτε έναν από τους παραπάνω χάρτες σε προβολή πλήρους οθόνης και επιλέξτε τον σύνδεσμο [License this photo (CC BY-NC-ND 4.0)] για να αντιγράψετε το απαιτούμενο κείμενο αναφοράς πηγής.
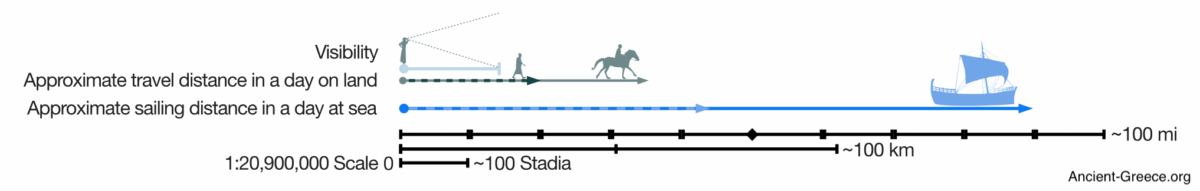
Visibility Horizon (not in all maps)
A “shaded” blue area extending out from each island and shoreline indicates an approximate distance of how far a human can see.
Approximate visibility distance on the map is set at 16 km, or 10 mi. (at sea level: 3 miles; with slight elevation 12 miles). Hopefully it is useful to gauge distances and proportions, especially between the islands.
Circle of Influence (not in all maps)
The radius represents approximate walking distance in a day, accepted here as 32 kilometers, or 20 miles, which can be traversed in about 6-8 hours at walking pace, and assessed to be the maximum distance where locals would interact with the land, each other, and their neighbors within overlapping areas during a day. Most activity around a city would probably be taking place around a radius of 6-8 miles, which is a distance a person could cover in a couple of hours on foot. A horse/mule or a cart, and other conditions would affect distance and time, but this map does not account for that.
In ancient Greece, a city’s center itself, as well as the surrounding countryside, farms, and villages that provided resources and supported the city’s population, or its polis, extended to a radius of approximately 15-20 kilometers (9-12 miles). The specific radius would vary depending on factors like terrain, population density, and the presence of other nearby settlements. An average person can walk about 25 miles in a day.
The radius does not factor a settlement’s renown or environs, so all radii are equal.
Design tools used to make these maps

![]()
![]()
![]()
Natural Earth, QGIS, Affinity Designer, PDF. The PDF format was chosen as final output for its simplicity, usability, versatility, and printability. Ancient-Greece.org is not affiliated with any of these tools.
-
Ancient Greece Maps | Χάρτες της Αρχαίας Ελλάδας
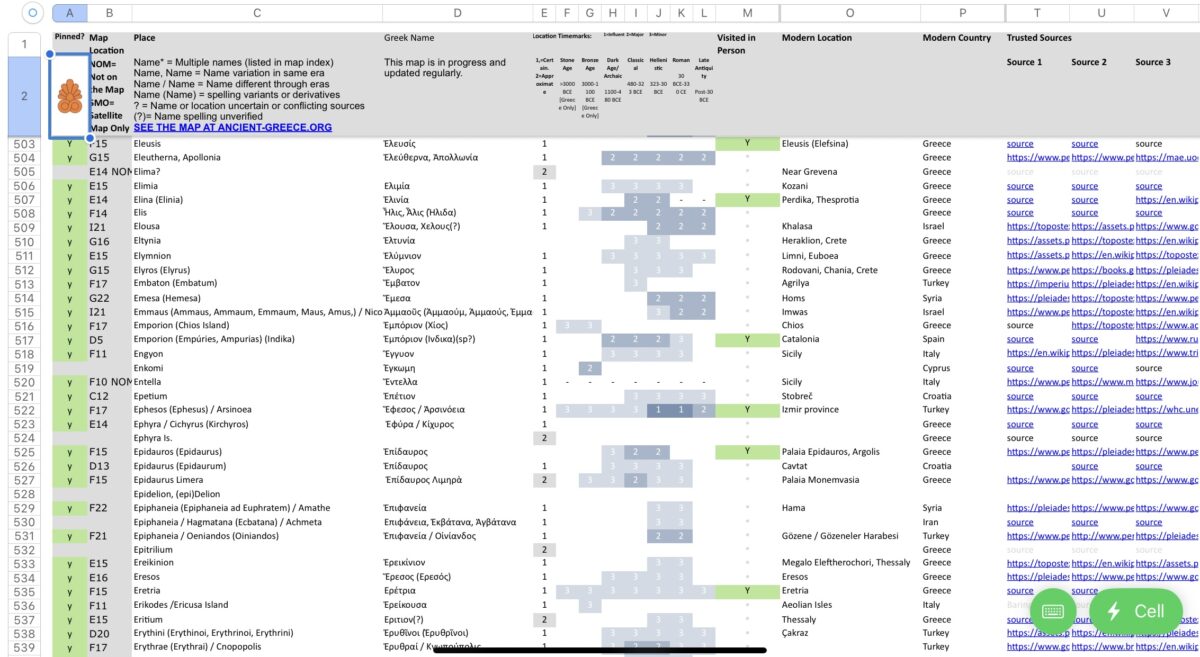
Ancient Greece Map index of places
Mapping Ancient Greece and the Challenge of Diachronicity (ATINER symposium presentation, June 2026)
Progress | Πρόοδος
The Master Map of Ancient Greece includes every major and minor settlement researched in the last 25 years. It includes the entire area of Greek Civilization’s expance from Iberia, to the Black Sea, and from Egypt, to India. All of our maps are derived from this one.
The map is a living document in a constant state of development, with new additions, corrections, and amendments presented in each version.
Version numbers are located in the map legend.
Settlements: ~99% completed
Roads (inc. Roman/Late): 90%
Mountains: in progress
Rivers: in progress
Mines/Quarries: in progress
Sea routes: 90%
Civilizations: 99%
Battles: in progress
Sanctuaries: 99%
Spell-checking English: 1%
Spell-checking Greek: 40%
Theaters: 99%
Known Bugs
Zoomin stops:
Cannot zoom all the way in to read the smaller text when you click and open the image on a browser.
Solution: Download the file and use a PDF reader app for access to all the map features and layers.
Color Key
F6E9B5
CF9970
ECECE2
6F898B
1A4548
C5D1B5
92CB75
65BC45
BED7E8
70A7E8
0D79F2
DA9FFF
B0558F
7300A7
808080
F20D0D
000000