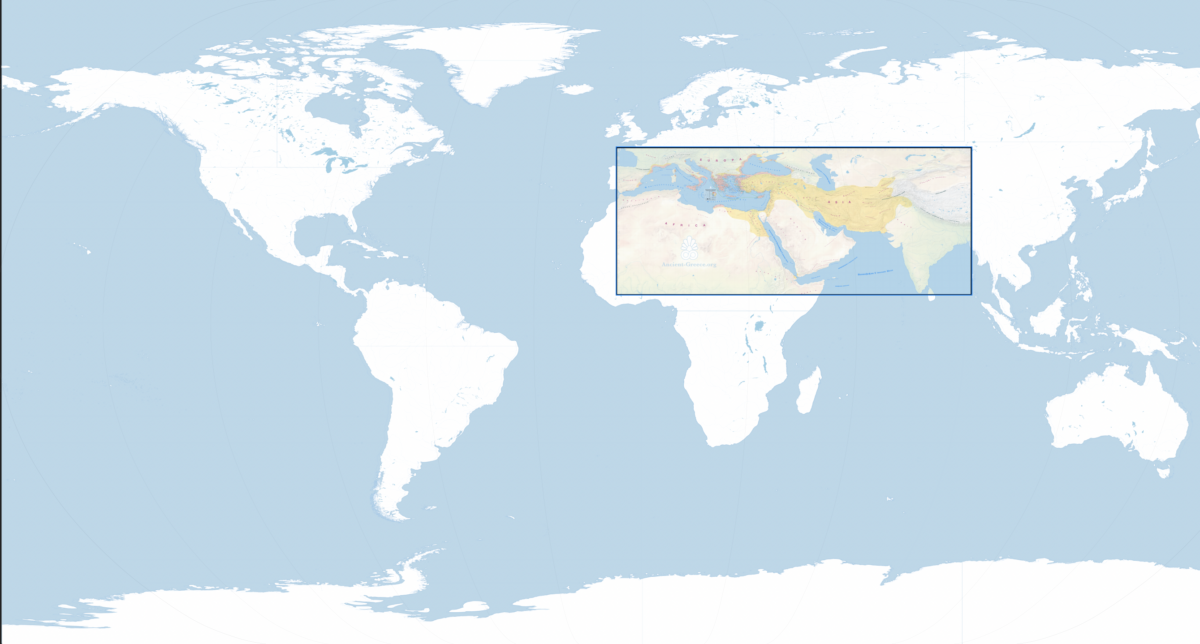
Master Map, Maximum Extent
3 MA to 30 BCE
Κεντρικός Χάρτης Μέγιστη Εξάπλωση
3 εκ εως 30 πΧ
PDF: Zoom x10, Search, Print 138.89 × 62.5 inches (352.78 × 158.75 cm). Printing note: Anything smaller than full size will have text too small to read.
Our most detailed and complete in area coverage map of Ancient Greece (3 Ma ~ 30 BCE, Stone Age to about Imperial Rome), designed to be the ultimate companion for studying and research in Ancient Greece.
Ο πιο λεπτομερής και πλήρης σε εδαφική κάλυψη χάρτης μας της Αρχαίας Ελλάδας (3 εκ. έτη ~ 30 π.Χ., από την Εποχή του Λίθου έως περίπου την Αυτοκρατορική Ρώμη), σχεδιασμένος για να αποτελεί το κορυφαίο βοήθημα για τη μελέτη και την έρευνα της Αρχαίας Ελλάδας.
PDF: Μεγέθυνση (Zoom) x10, Δυνατότητα Αναζήτησης, Διαστάσεις Εκτύπωσης 138,89 × 62,5 ίντσες (352,78 × 158,75 εκ.). Σημείωση εκτύπωσης: Σε οποιοδήποτε μέγεθος μικρότερο από το φυσικό, το κείμενο θα είναι υπερβολικά μικρό για να αναγνωσθεί.
Illustrated Map of Ancient Greece | Εικονογραφημένος
Illustrated
3 MA to 30 BCE
Εικονογραφημένος
3 εκ εως 30 πΧ
PNG: 17 MB, Zoom x4, Print 41.64 × 19.43 inches (105.76 × 49.35 cm)
Highlights | Συνοπτικός
Highlights 3 MA to 30 BCE
Συνοπτικός 3 εκ εως 30 πΧ
PNG: Zoom x4, Print 41.64 × 19.43 inches (105.76 × 49.35 cm)
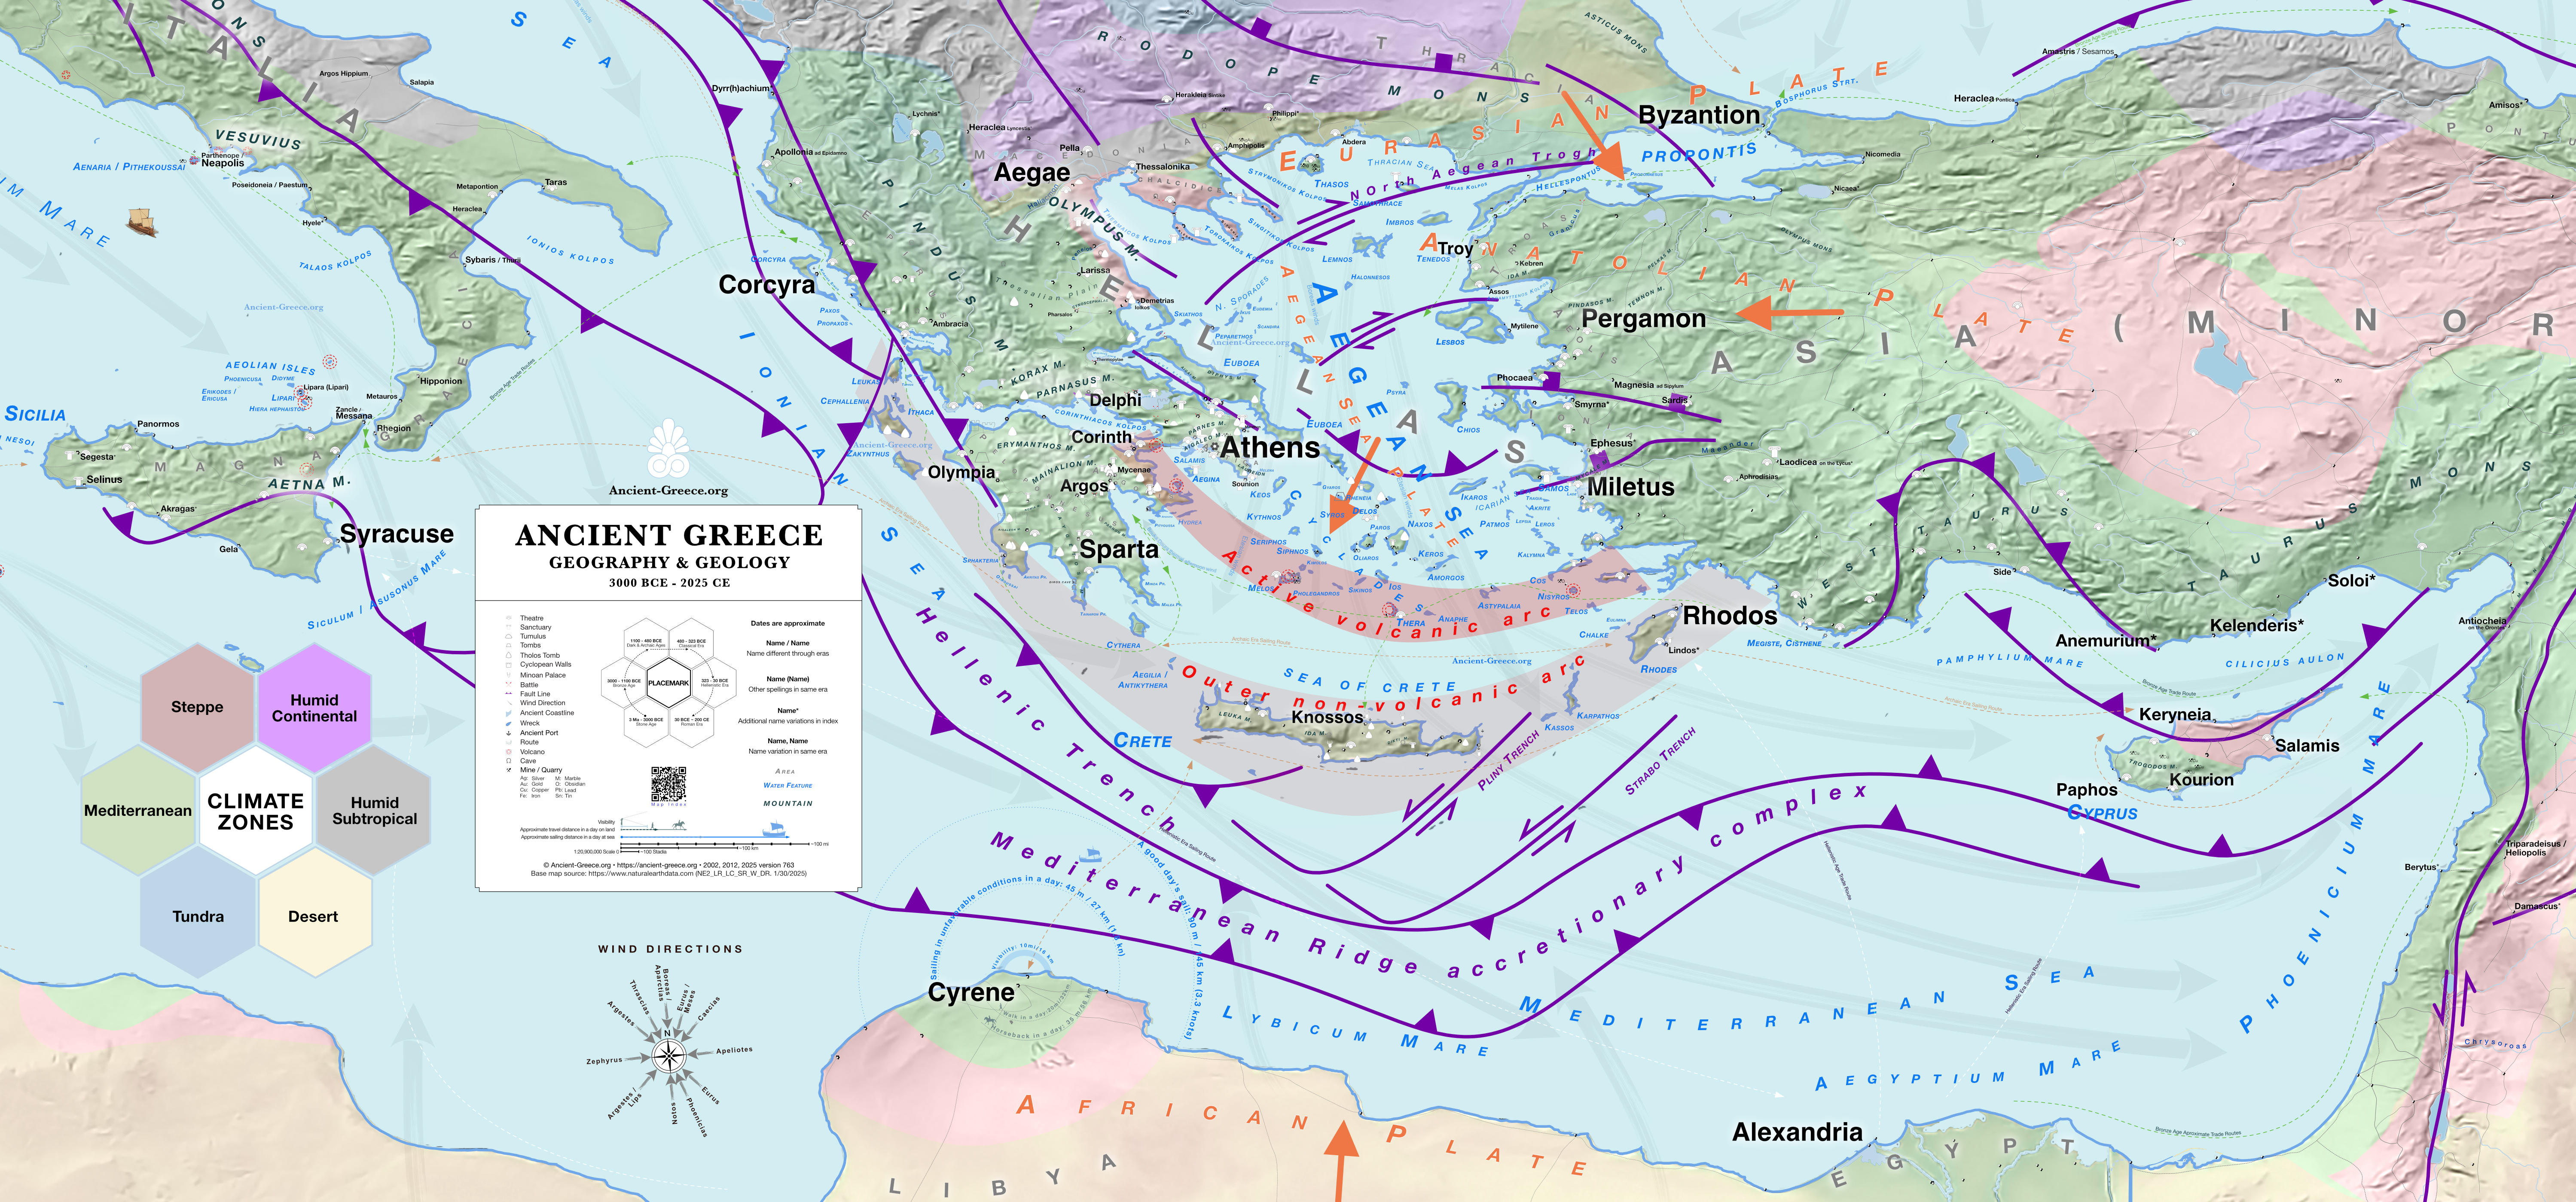
Geology and Geography
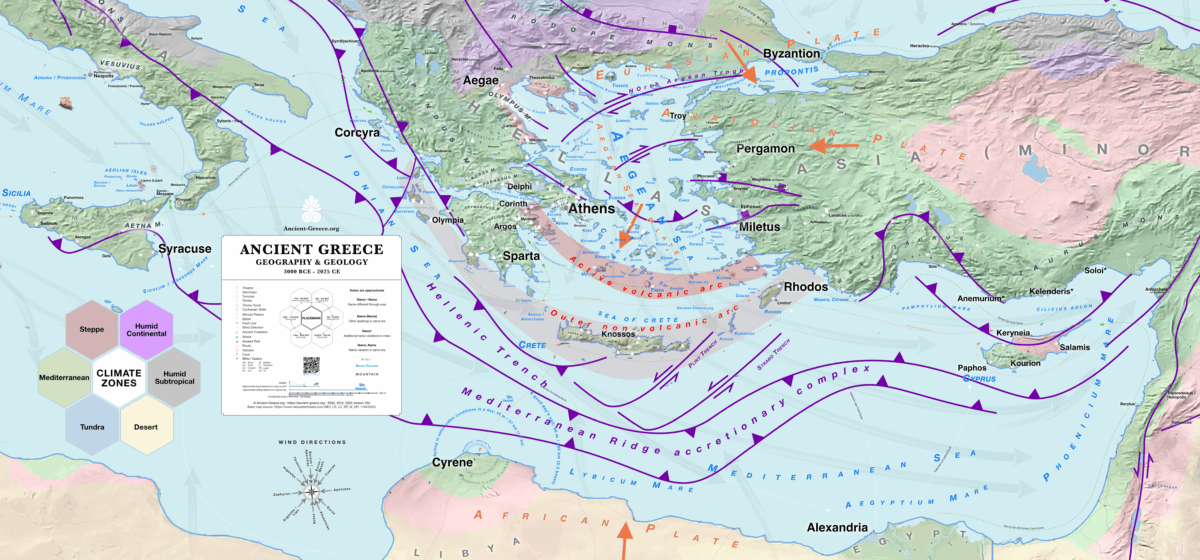
Geography and Geology
3000 BCE to 2025 CE
PNG: Zoom x4, Print 41.64 × 19.43 inches (105.76 × 49.35 cm)
Ancient Greece Map Archive
Archive: Original Map (Showing 1–30 of 31)
The archive contains all the available maps, in different versions or file types.
To obtain a free license, open the image in a full-screen view and select the [License this photo (CC BY-NC-ND 4.0)] link to copy the required attribution text.
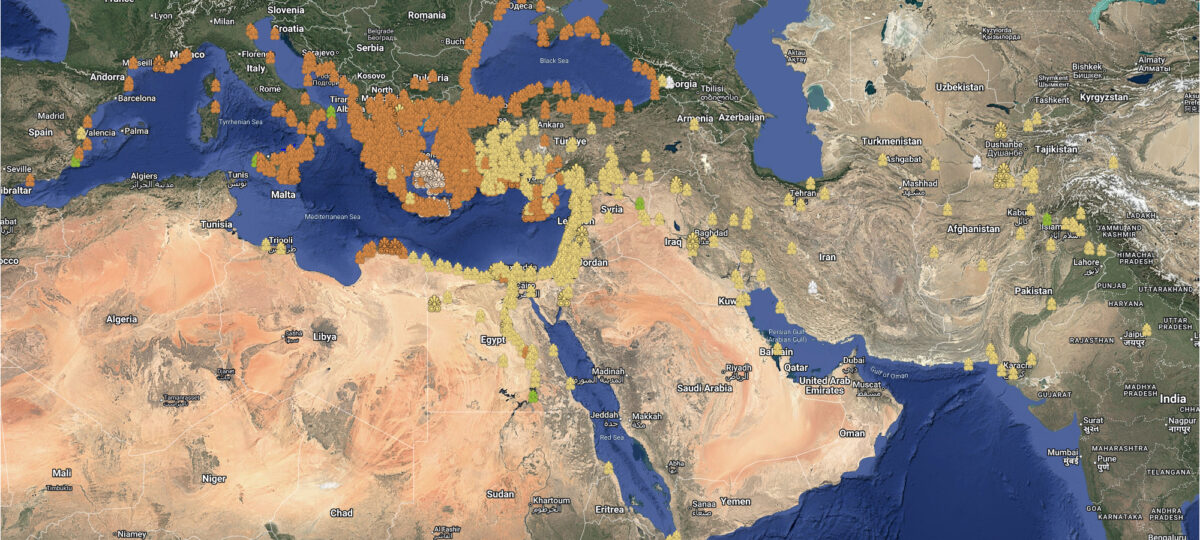
Working Draft 3 MA ~ 200 CE
Used as a quick “pin-board”, the kml contains a lot of raw data for notation and research. Version: Perpetuall β.
Ancient Greece Settlements Working File on Google Maps
Ancient Greece Settlements Working File on Google Earth
Legend | Υπόμνημα
Placemarks & Timemarks | Τοπόσημα & Χρονόσημα
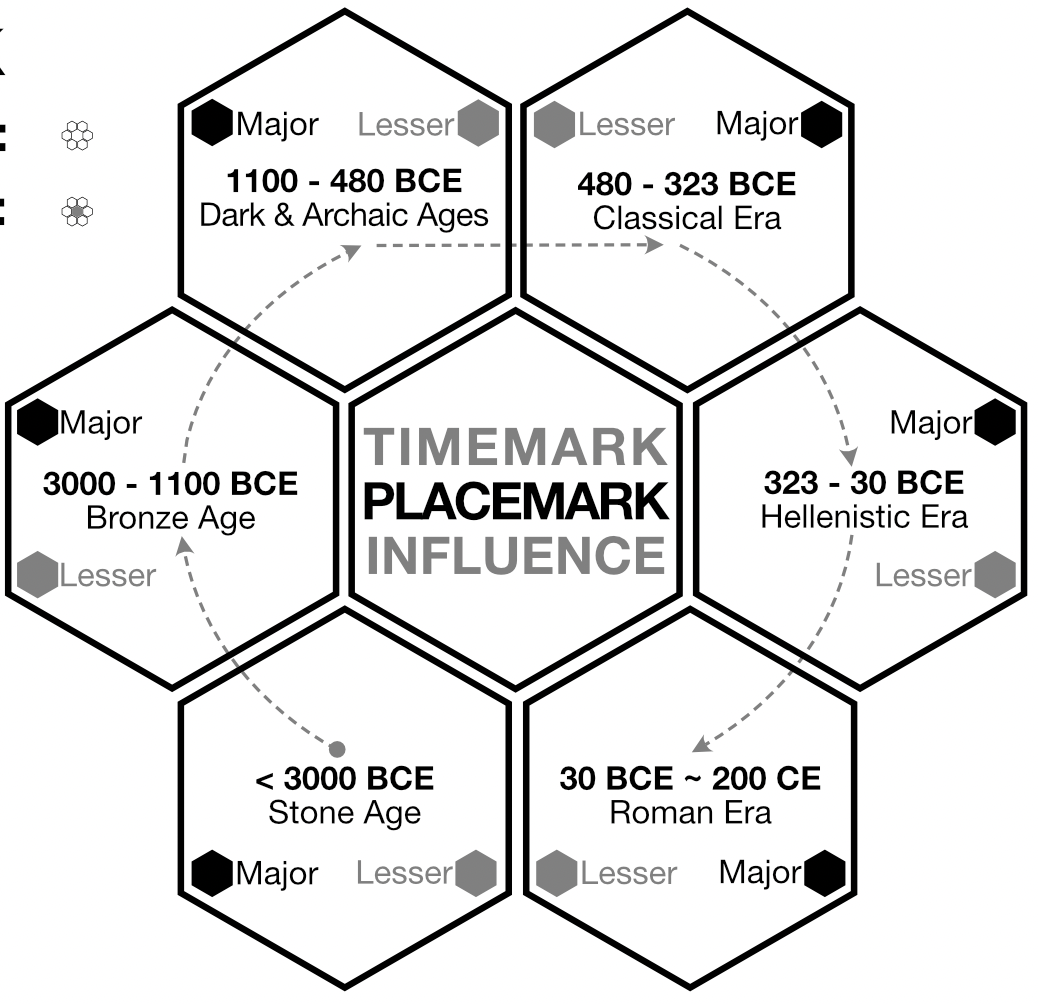
The place-mark is also a time-mark that illustrates the story of ancient Greek settlements through time, at a glance.
It shows with a quick look, during which periods a place was relevant (inhabited, administered, etc.) for Hellenic civilization, and what its influence was in that era. In a cluster of cities, the more ancient ones will have hexagons active on the left, while in the later settlements, the right hexagons will be tinted.
Central hexagon: Location
White = certain (verified by archaeological and authoritative sources)
Gray = approximate
Ring of Hexagons (FILL): Influence
Black: Major influence for that era
Gray: Lesser influence in that era
Empty: Unoccupied, or unverified occupation in the era
Ring of Hexagons (POSITION): Time
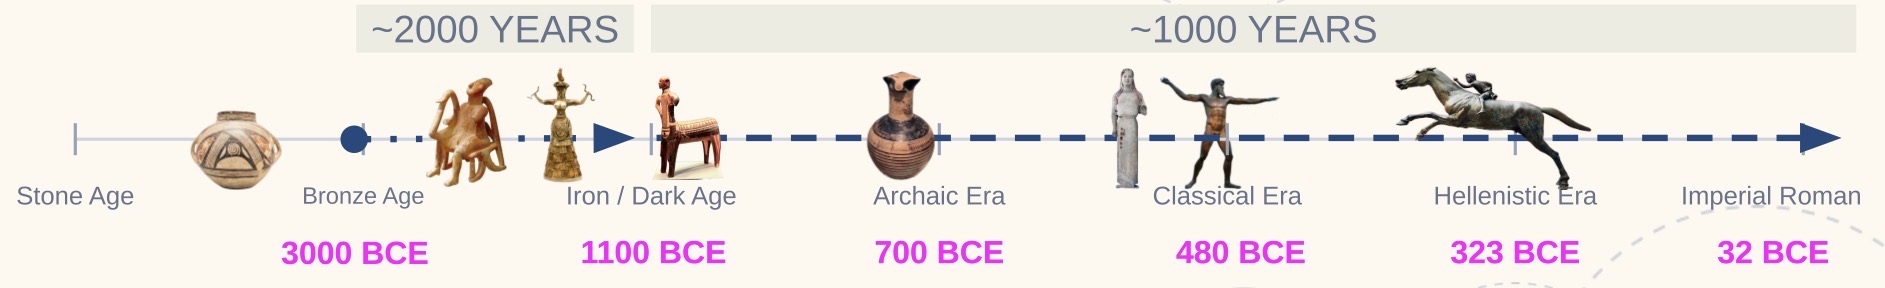
Bottom Left: Stone Age (>3000 – 1100 BCE)
Left: Bronze Age (3000- 1100 BCE)
Top Left: Dark Age & Archaic Era 1100 – 480 BCE)
Top Right: Classical Era (480 – 323 BCE)
Hellenistic Era: (323 – 30 BCE)
Bottom Right: Roman Era (30 BCE ~ 200 CE)
All placemarks are the same size. Relative importance in each era is indicated by the corresponding timemark fill, and the overall influence is indicated by the text size and weight (bold text).
Timemarks indicate the general level of importance of the site, for each era, as construed from the various sources. The sources in the index for each place provide the main guidance in determining each era’s importance.
Place Names
The Ancient Greece Map spans three thousand years and, naturally, many settlements changed their name over that span. Often, the ancients in their own time referred to places by different names or derivatives. To make things more confusing, in subsequent studies over the centuries, transliteration from Greeek to Latin characters never followed consistent rules. As a result, many settlements are known by several name variants.
To fit as many places as possible, only one of the known names for each place is given on the map where space is tight. In that case an asterisk indicates that alternative names for each place can be found in the map index, in their English and Ancient Greek versions.
The following naming conventions are used on the maps to reflect a places’ name variations over the centuries:
Name*: Additional name variations in the index
Name (Name): Other spellings or derivatives
Name, Name: Different names in same era
Name / Name: Name different through eras
Typography
Type size and weight denote the relative importance of each place, but in areas of tight space, a smaller font has been used.
Fonts: Helvetica Neue, Baskerville, and Pangolin.
The following typography guidelines give a good approximation of a place’s importance:
12 pt. Name: Place of Renown
10 pt. Name: Place of Influence
8 pt. Name: Place of Importance
7, 6, 5 pt. Name: Place of importance, or influence in tight space
smaller than 8 pt. Name: Place of note in tight space
In general, when space is tight, fonts get a click smaller; when space is ample, the largest possible fonts for each significance is used.
Το τοπόσημο αποτελεί ταυτόχρονα και χρονόσημο που εικονογραφεί την ιστορία των αρχαιοελληνικών οικισμών μέσα στον χρόνο, με μια ματιά.
Δείχνει με μια γρήγορη ματιά, κατά τη διάρκεια ποιων περιόδων ένας τόπος ήταν σημαντικός (κατοικήθηκε, διοικήθηκε κ.λπ.) για τον ελληνικό πολιτισμό, και ποια ήταν η επιρροή του σε εκείνη την εποχή. Σε ένα σύμπλεγμα πόλεων, οι αρχαιότερες θα έχουν ενεργά τα εξάγωνα στα αριστερά, ενώ στους μεταγενέστερους οικισμούς θα είναι χρωματισμένα τα δεξιά εξάγωνα.
Κεντρικό εξάγωνο: Τοποθεσία
Λευκό = βέβαιη (επιβεβαιωμένη από αρχαιολογικές και έγκυρες πηγές)
Γκρι = κατά προσέγγιση
Δακτύλιος Εξαγώνων (ΓΕΜΙΣΜΑ): Επιρροή
Μαύρο: Σημαντική επιρροή για εκείνη την εποχή
Γκρι: Μικρότερη επιρροή σε εκείνη την εποχή
Άδειο: Ακατοίκητο, ή ανεπιβεβαίωτη κατοίκηση την εποχή εκείνη
Δακτύλιος Εξαγώνων (ΘΕΣΗ): Χρόνος
Κάτω Αριστερά: Εποχή του Λίθου (>3000 – 1100 π.Χ.)
Αριστερά: Εποχή του Χαλκού (3000 – 1100 π.Χ.)
Πάνω Αριστερά: Σκοτεινοί Αιώνες & Αρχαϊκή Εποχή (1100 – 480 π.Χ.)
Πάνω Δεξιά: Κλασική Εποχή (480 – 323 π.Χ.)
Ελληνιστική Εποχή: (323 – 30 π.Χ.)
Κάτω Δεξιά: Ρωμαϊκή Εποχή (30 π.Χ. ~ 200 μ.Χ.)
Όλα τα τοπόσημα έχουν το ίδιο μέγεθος. Η σχετική σημασία σε κάθε εποχή υποδηλώνεται από το αντίστοιχο γέμισμα του χρονόσημου, και η συνολική επιρροή υποδηλώνεται από το μέγεθος και το βάρος του κειμένου (έντονη γραφή).
Τα χρονόσημα υποδεικνύουν το γενικό επίπεδο σημασίας της τοποθεσίας, για κάθε εποχή, όπως προκύπτει από τις διάφορες πηγές. Οι πηγές στο ευρετήριο για κάθε τοποθεσία παρέχουν τον κύριο οδηγό για τον καθορισμό της σημασίας κάθε εποχής.
Ονόματα Τοποθεσιών
Ο Χάρτης της Αρχαίας Ελλάδας καλύπτει τρεις χιλιάδες χρόνια και, φυσικά, πολλοί οικισμοί άλλαξαν όνομα κατά τη διάρκεια αυτής της περιόδου. Συχνά, οι αρχαίοι στην εποχή τους αναφέρονταν σε μέρη με διαφορετικά ονόματα ή παράγωγά τους. Για να γίνουν τα πράγματα πιο περίπλοκα, σε μεταγενέστερες μελέτες στο πέρασμα των αιώνων, η μεταγραφή από τους ελληνικούς στους λατινικούς χαρακτήρες δεν ακολούθησε ποτέ συνεπείς κανόνες. Ως αποτέλεσμα, πολλοί οικισμοί είναι γνωστοί με αρκετές παραλλαγές ονομάτων.
Για να χωρέσουν όσο το δυνατόν περισσότερα μέρη, δίνεται μόνο ένα από τα γνωστά ονόματα για κάθε τοποθεσία στον χάρτη όπου ο χώρος είναι περιορισμένος. Σε αυτή την περίπτωση, ένας αστερίσκος υποδηλώνει ότι εναλλακτικά ονόματα για κάθε τοποθεσία μπορούν να βρεθούν στο ευρετήριο του χάρτη, στην αγγλική και την αρχαιοελληνική τους εκδοχή.
Στους χάρτες χρησιμοποιούνται οι ακόλουθες συμβάσεις ονοματολογίας για να αντικατοπτρίζουν τις παραλλαγές των ονομάτων μιας τοποθεσίας ανά τους αιώνες:
Όνομα*: Πρόσθετες παραλλαγές ονόματος στο ευρετήριο
Όνομα (Όνομα): Άλλες ορθογραφίες ή παράγωγα
Όνομα, Όνομα: Διαφορετικά ονόματα στην ίδια εποχή
Όνομα / Όνομα: Διαφορετικό όνομα ανά τις εποχές
Τυπογραφία
Το μέγεθος και το βάρος της γραμματοσειράς υποδηλώνουν τη σχετική σημασία κάθε τοποθεσίας, αλλά σε περιοχές με περιορισμένο χώρο, έχει χρησιμοποιηθεί μικρότερη γραμματοσειρά.
Γραμματοσειρές: Helvetica Neue, Baskerville και Pangolin.
Οι ακόλουθες τυπογραφικές οδηγίες δίνουν μια καλή προσέγγιση της σημασίας μιας τοποθεσίας:
Όνομα 12 pt.: Τοποθεσία Φήμης
Όνομα 10 pt.: Τοποθεσία Επιρροής
Όνομα 8 pt.: Τοποθεσία Σημασίας
Όνομα 7, 6, 5 pt.: Τοποθεσία σημασίας ή επιρροής σε περιορισμένο χώρο
Όνομα μικρότερο από 8 pt.: Τοποθεσία άξια λόγου σε περιορισμένο χώρο
Γενικά, όταν ο χώρος είναι περιορισμένος, οι γραμματοσειρές γίνονται ένα «κλικ» μικρότερες. Όταν ο χώρος είναι άπλετος, χρησιμοποιούνται οι μεγαλύτερες δυνατές γραμματοσειρές για κάθε βαθμό σημαντικότητας.
Colors
Period area highlights in general are assigned these colors:
Stone
Age
0C78F252
Bronze Age
93CC7642
Iron Age
F0764687
Classical Era
DA9EFF69
Hellenistic Era
F6E9B5
Visualizations | Οπτικοποιήσεις
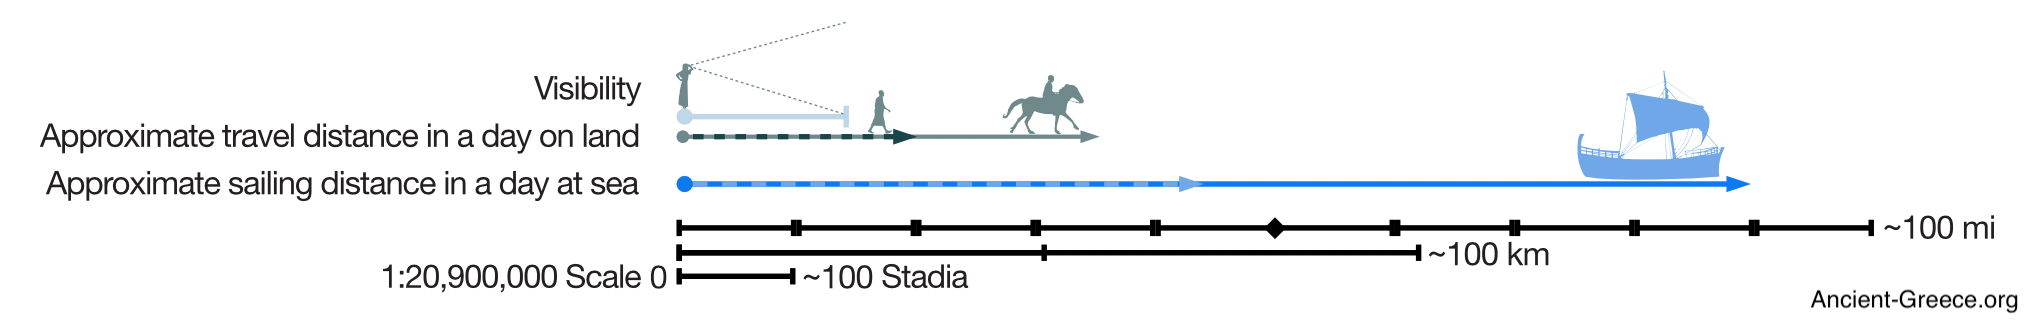
The scale bar is approximate. The “stadia” scale is based on the reported ancient distance from Athens to Dekeleia of 120 stadia (Thucidydes).
Several map features have human scale indicators to help visualizing distances between places, including a “local city radius”, a “visibility horizon”, and several graphics representing approximate distance traversed in a day on foot, horseback, or by sailing in favorable or unfavorable conditions.
The wind patterns of the Mediterranean profoundly shaped ancient history and culture, influencing everything from seasonal trade to military campaigns. In the era of sailing ships, prevailing winds were as critical to commerce and communication as mountains and valleys were to land travel.
Our map includes an approximate graphic representation of these wind patterns to illustrate their effect on the direction, speed, duration, and reach of ancient maritime travel.
Η κλίμακα είναι κατά προσέγγιση. Η κλίμακα των «σταδίων» βασίζεται στην αναφερόμενη αρχαία απόσταση από την Αθήνα έως τη Δεκέλεια των 120 σταδίων (Θουκυδίδης).
Αρκετά στοιχεία του χάρτη διαθέτουν δείκτες ανθρώπινης κλίμακας για να βοηθήσουν στην οπτικοποίηση των αποστάσεων μεταξύ τοποθεσιών, συμπεριλαμβανομένης μιας «ακτίνας τοπικής πόλης», ενός «ορίζοντα ορατότητας» και πολλών γραφικών που αναπαριστούν την κατά προσέγγιση απόσταση που διανύεται σε μία ημέρα με τα πόδια, με άλογο ή με ιστιοπλοΐα υπό ευνοϊκές ή δυσμενείς συνθήκες.
Τα μοτίβα των ανέμων της Μεσογείου διαμόρφωσαν βαθιά την αρχαία ιστορία και τον πολιτισμό, επηρεάζοντας τα πάντα, από το εποχικό εμπόριο έως τις στρατιωτικές εκστρατείες. Στην εποχή των ιστιοφόρων πλοίων, οι επικρατούντες άνεμοι ήταν εξίσου κρίσιμοι για το εμπόριο και την επικοινωνία όσο ήταν τα βουνά και οι κοιλάδες για τα χερσαία ταξίδια.
Ο χάρτης μας περιλαμβάνει μια κατά προσέγγιση γραφική αναπαράσταση αυτών των μοτίβων των ανέμων για να εικονογραφήσει την επίδρασή τους στην κατεύθυνση, την ταχύτητα, τη διάρκεια και την εμβέλεια των αρχαίων θαλάσσιων ταξιδιών.
Base Map | Βάσικός Χάρτης
The base map is based on Natural Earth NE2_LR_LC_SR_W_DR version 2.0.0 https://www.naturalearthdata.com (1/30/2025)
Ο βασικός χάρτης βασίζεται στο Natural Earth NE2_LR_LC_SR_W_DR έκδοση 2.0.0 https://www.naturalearthdata.com
(30/1/2025)
1:20,900,000
Index and Sources | Ευρετήριο και Πηγές
The Master Map includes over from the Stone Age to the Roman Era, each hand-pinned after verification with trusted sources.
A general list of sources can be found in the bibliography, while the map index contains place-specific sources.
Ο Κύριος Χάρτης περιλαμβάνει τοποθεσίες από την Εποχή του Λίθου έως τη Ρωμαϊκή Εποχή, καθεμία τοποθετημένη με το χέρι μετά από επαλήθευση με αξιόπιστες πηγές.
Μια γενική λίστα πηγών βρίσκεται στη βιβλιογραφία, ενώ το ευρετήριο του χάρτη περιέχει πηγές ειδικές για κάθε τοποθεσία.